If you work on a digital product, you most likely use metrics to track its performance, prioritize work, align teams and find areas of focus.
A very popular framework to orchestrate metrics is John Cutler’s North Star Metric framework:
The North Star Framework is a model for managing products by identifying a single, crucial metric that (…) “best captures the core value that your product delivers to [its] customers.”
In addition to the metric, the North Star Framework includes a set of key inputs that collectively act as factors that produce the metric. Product teams can directly influence these inputs with their day-to-day work.
Here’s what it looks like:
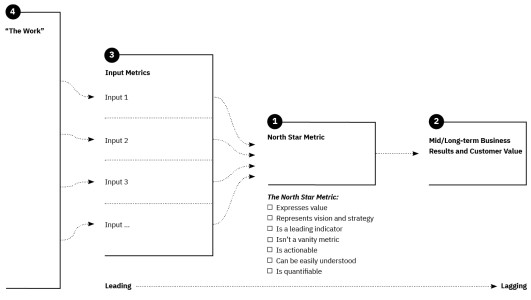 The North Star Metric framework. (Source)
This key metric and its inputs aim to answer the question “How much value is our product actually delivering to customers?” in ways that are actionable.
It also brings some order to the product strategy mess, by adding relationships between behaviors that we can influence through product decisions and the desired business outcome (often, the dollars).
When putting the framework in action —the folks at Amplitude made an excellent Playbook available on their website—, I found that figuring out these relationships was not straight forward. And this was specially the case when working with team members with a diverse background (engineering, design, product management, analytics, etc).
How to identify what’s an “input metric” (a measurable outcome that can predict impact on our ultimate desired result), what’s our North Star, and what’s a “lagging metric” (measurable value captured, usually a business indicator)?
Basadur to the rescue
In my past life building products for others, I applied Basadur Challenge Mapping to help teams find the best desirable, reachable, ambitious problem on which investments should be made.
Min Basadur is a Canadian teacher, consultant and researcher who used to work for Procter & Gamble in the 60s. His work has vastly influenced how companies systematize innovation and the way teams around the world collaborate on creative processes.
On his Simplex innovation and creative problem solving process, you’ll find concepts like divergence and convergence (also known as the diamond, probably influenced by Béla_H._Bánáthy), deferral of judgement, or the use of “How Might We?” statements to define problems.
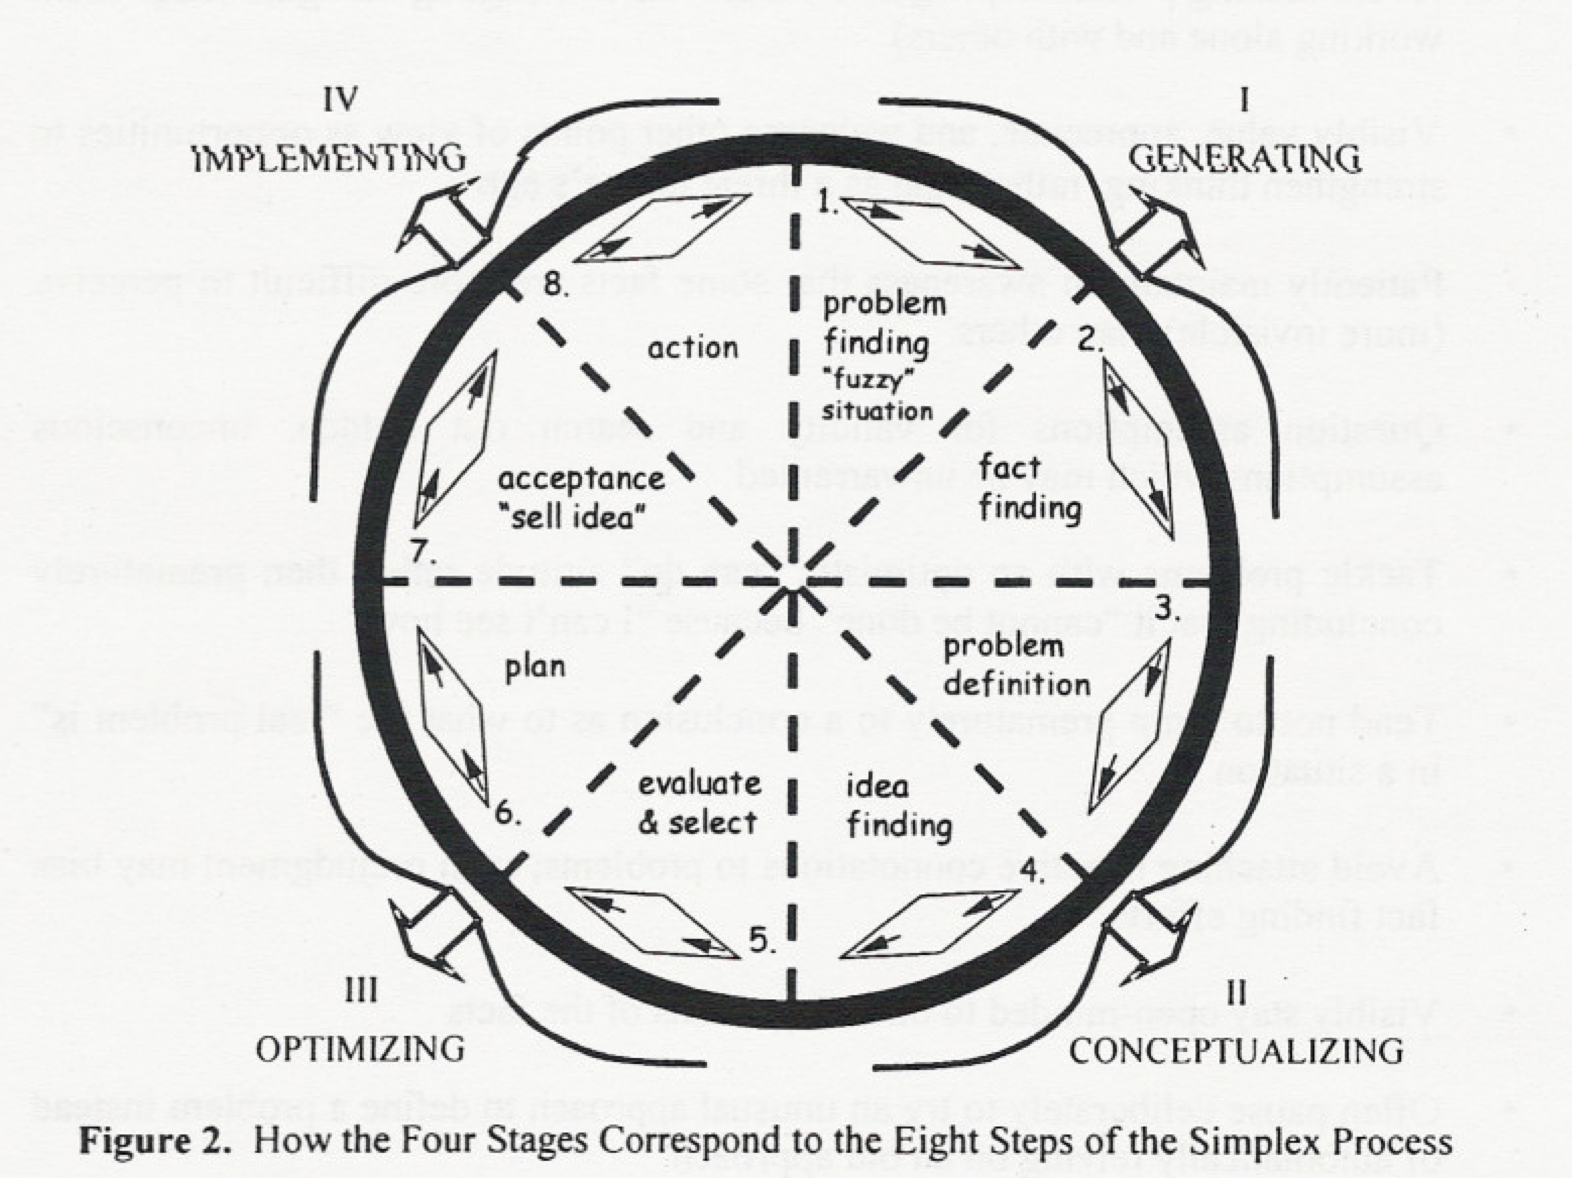 Who wants a double diamond when you can get an octuple diamond? Source PDF
Simplex suggests Challenge Mapping as a convergence method during Problem definition.
Challenge Mapping basically works like this: you have a bunch of “problems” that you think are relevant, and you state them as challenges using the “How might we…” formula. This is the divergence, the first vertex of the diamond.
Later, in order to converge, you arrange these challenges in a vertical axis that goes from “more strategic” to “more tactical”, finding relationships between them.
Here’s the magic:
- ⬆️ To go up, you can ask yourself “Why [would we want to achieve this]?” The answer will be a more strategic challenge.
- ⬇️ To go down (more tactical), you can ask “What’s stopping me/us? The answer will be a smaller, more tactical and actionable challenge.
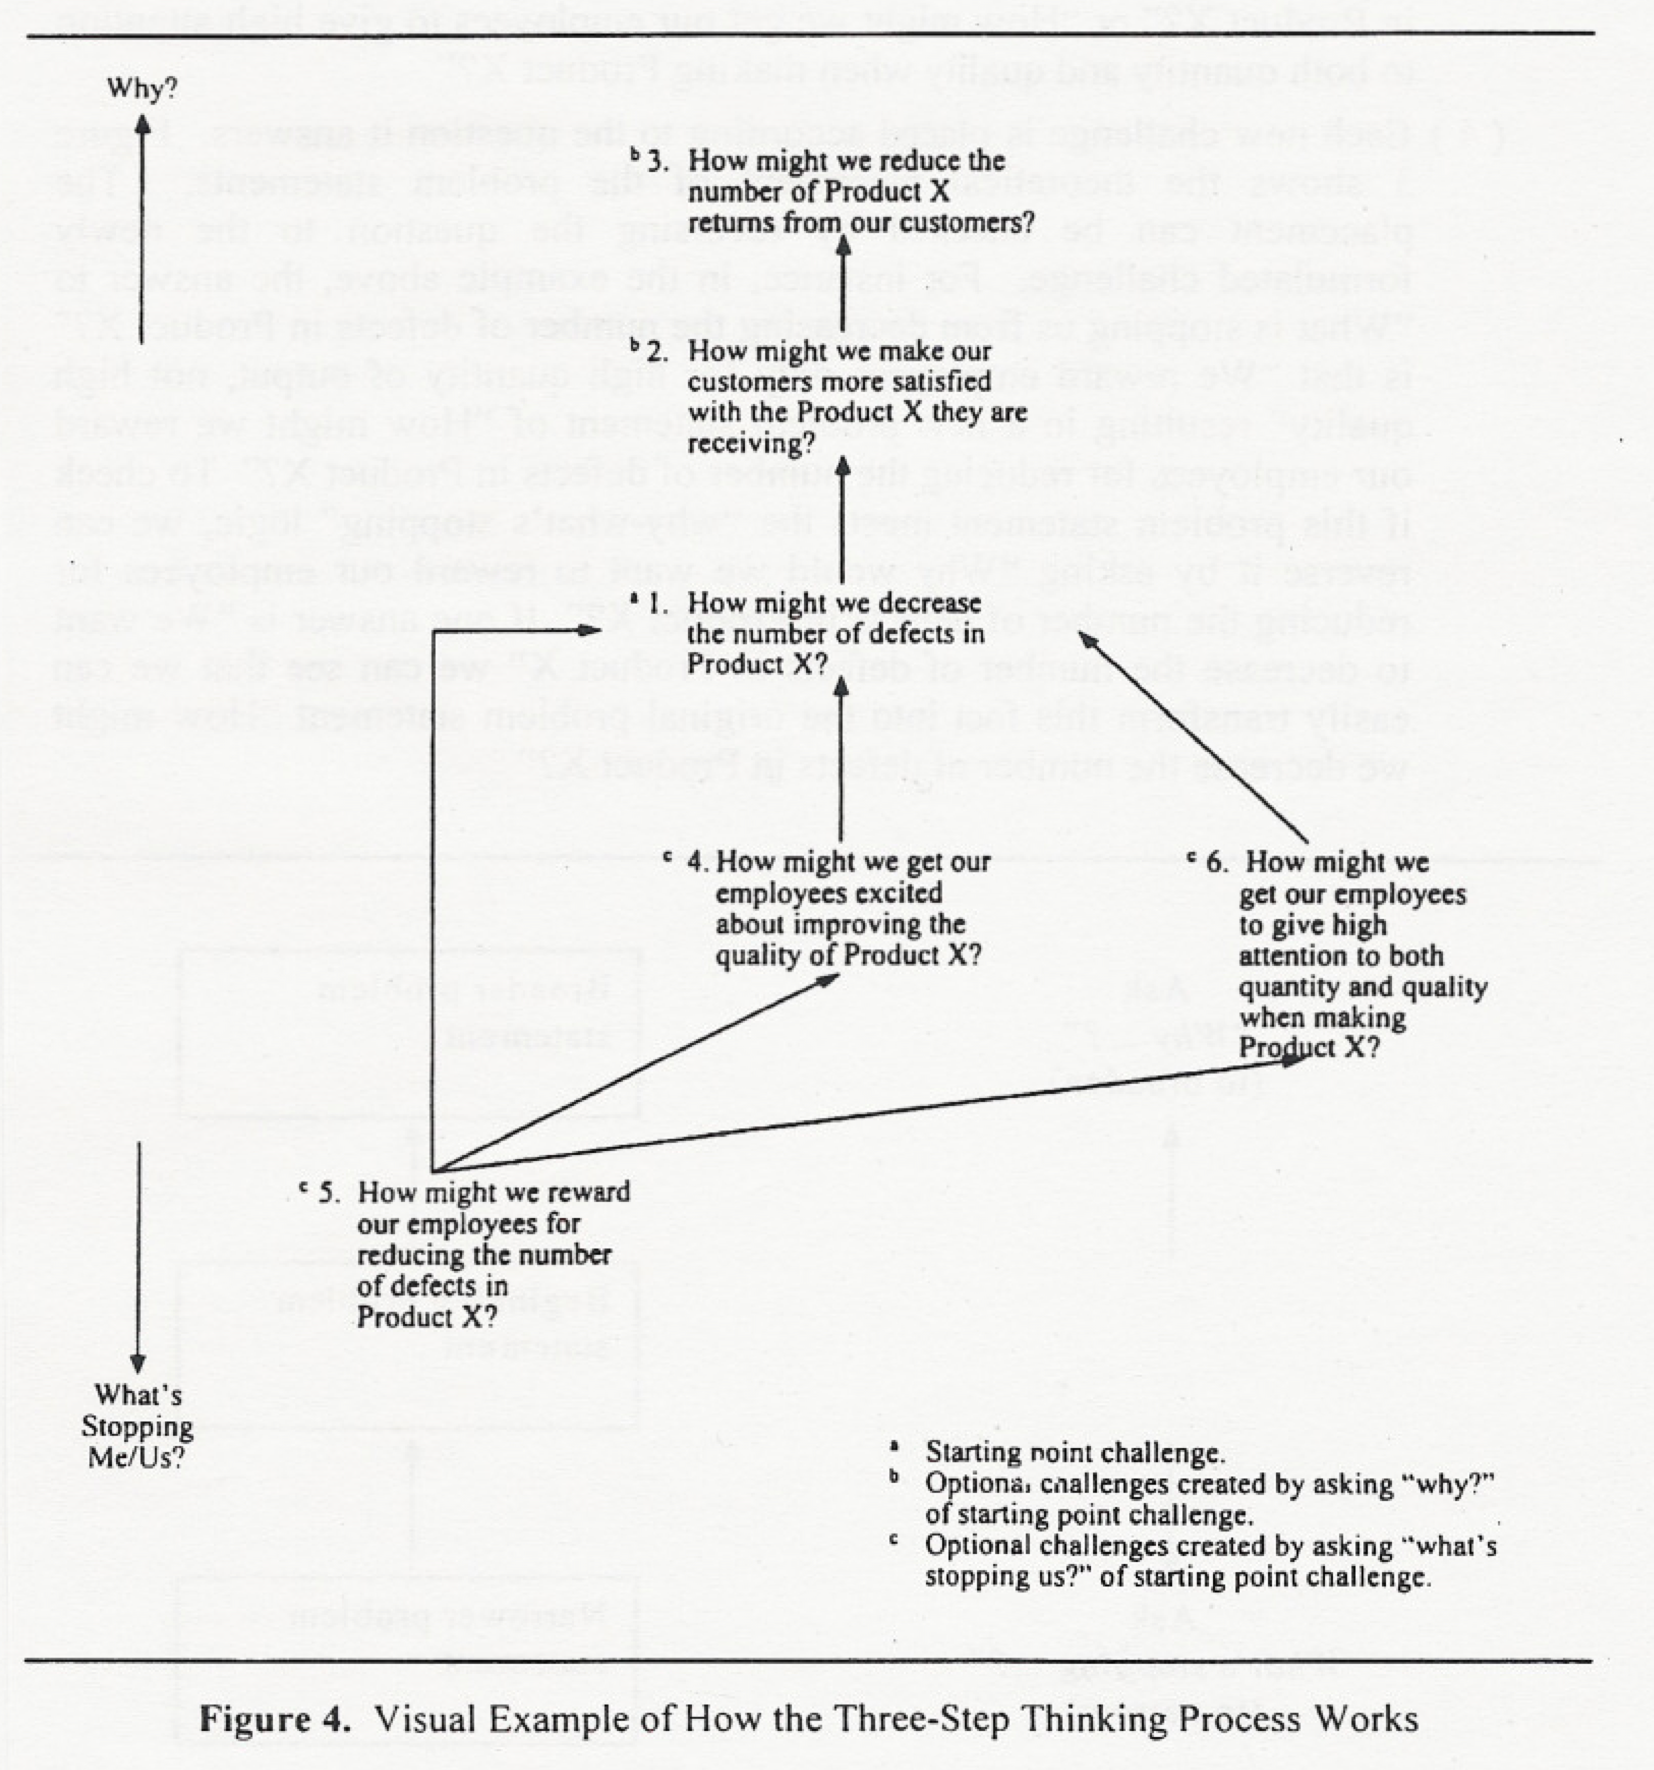 Basadur Challenge Map example. Source PDF
By mapping them using this technique, it is easier to know if a given challenge is interesting because it “unlocks” a bigger one, or if a given statement is too fuzzy, too big of an enterprise, and we should find a smaller, more actionable one.
The map also draws a correlation relationship between those challenges.
Putting it all together
Your product has a bunch of metrics the team considers relevant, and you want to find out which one should be the “North Star”, which ones are just lagging business outcomes, and which ones are leading ones that can provide early hints at future value generation.
For this example, I will use the ones shown on the Spotify example at the North Star Framework worksheets:
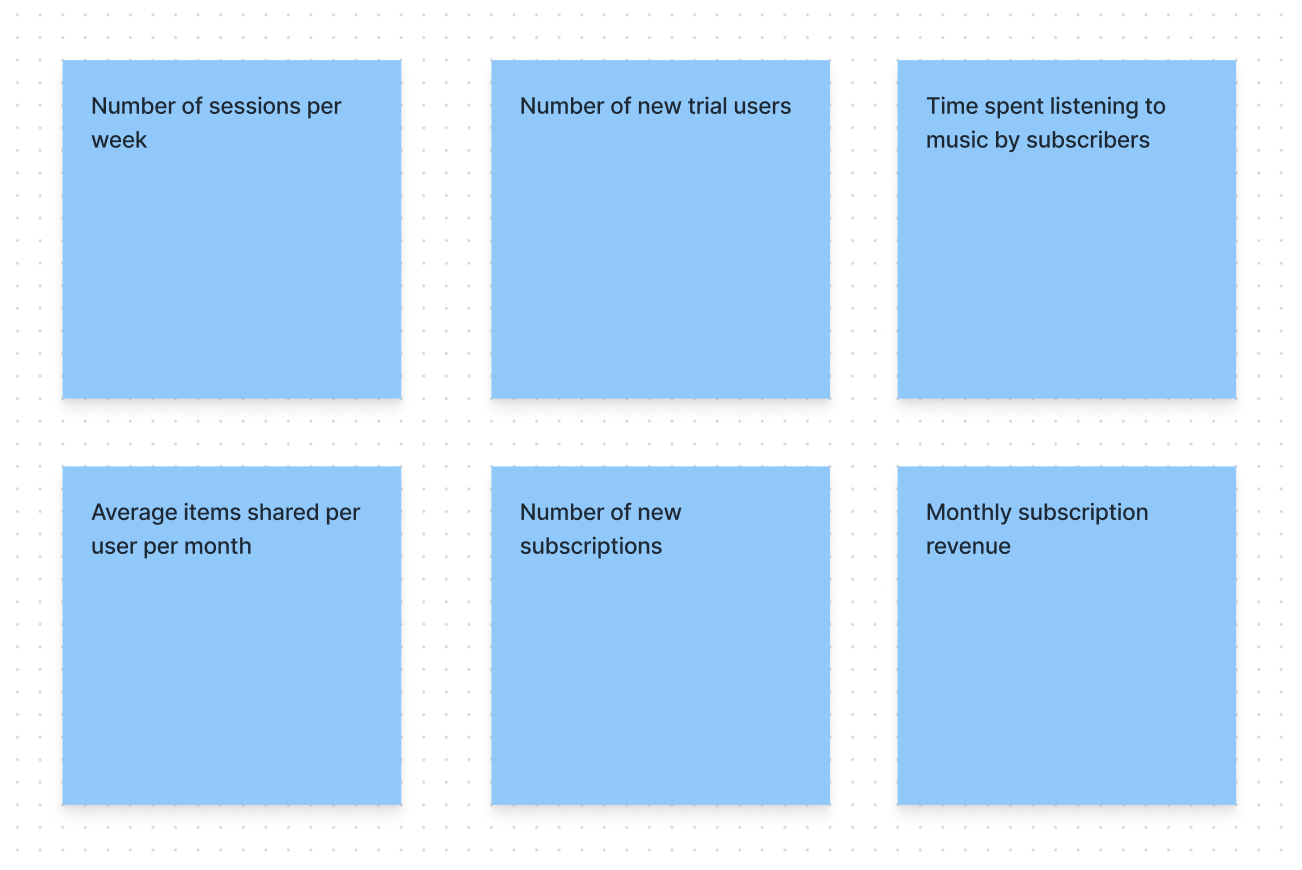 Metric divergence example. Content source
You can lay them out in a challenge map fashion, asking yourself why you want to achieve each of them and what’s stopping you from doing so.
According to Basadur, adding “How might we…” to a statement is most accepted among team members in the critical step of defining problems.
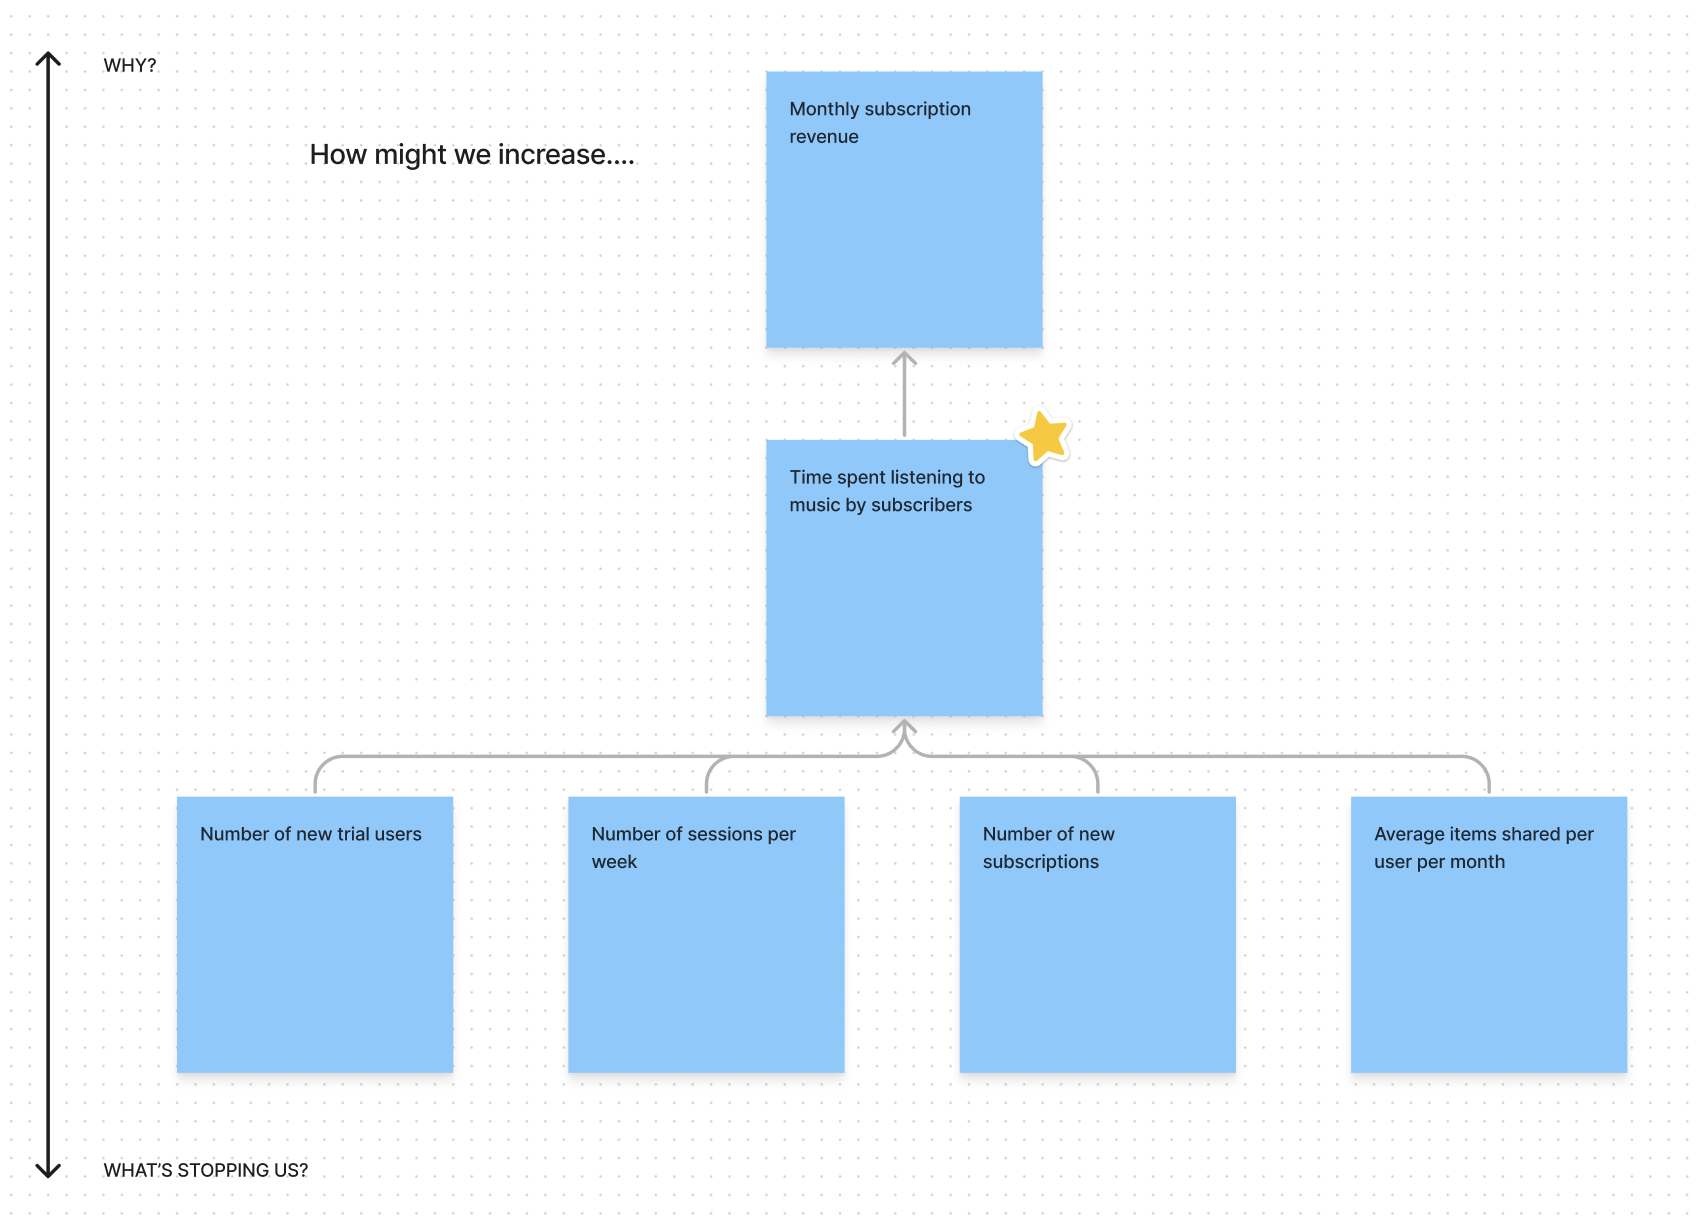 Metric convergence example. Content source
In my experience, asking “Why” and “What’s stopping us” helps the group come up with new problem statements (or metrics, in this case) that the group had not previously thought about, while adding “How might we…” works very well at a later stage, when coming up with ideas to improve each metric.
Recap
I’m not a big fan of frameworks. If applied blindly, the team can lose sight of why we are here. When a process is followed too strictly and without the proper context, any participant can feel disengaged and skeptical as soon as some part of the framework doesn’t resonate with them.
But having these methods and processes in my toolbox helps me make sense of the mess, and putting them in practice builds a common language and a shared mental model of the play field. Both things, clarity and alignment, are key when leading teams.
having these methods and processes in my toolbox helps me make sense of the mess, and putting them in practice builds a common language and a shared mental model of the play field.
- Ask “Why?” and “What’s stopping us” if you’re unsure about what else is worth measuring and pursuing, and about how each challenge relates to each other.
- Treat metrics as challenge statements by adding a “How might we…” to spark ideation.
Extra ball
If you are already implementing the North Star framework, Daniel Schmidt is building DoubleLoop, a tool that allows you recreate these maps, and then plug in actual data from your products, so your team can have a real time strategy map that even calculates correlation between metrics. You should check it out.